Milestones Project
The Milestones Project is a comprehensive, visual compendium of significant events in the histories of data visualization, statistical graphics and thematic cartography. This new version features an interactive timeline, an interactive map of authors' birthplaces, and a calendar of significant events in this history.
Quick links: Main page | Author map | Milestones calendar
Data Visualization Gallery
This Gallery of Data Visualization displays some examples of the Best and Worst of Statistical Graphics, with the view that the contrast may be useful, inform current practice, and provide some pointers to both historical and current work.
Quick links: Visit Gallery | Graph of the Week ... | Timelines | Minard
Books
Here are links to my books on data visualization and statistical graphics, as well as other related books of interest
- SAS System for Statistical Graphics
- Visualizing Categorical Data
- Visual Statistics
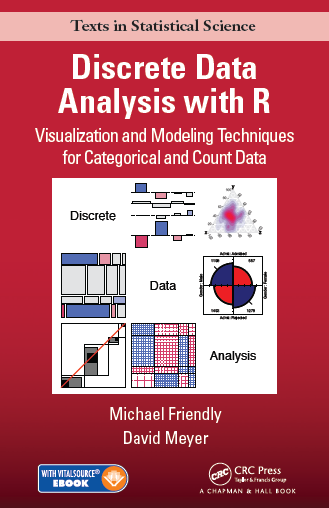
- Discrete Data Analysis with R

Courses & Short Courses
I teach a variety of courses in the Psychology Department at York University and short courses on statistical topics through the Statistical Consulting Service at York. Here are links to those which contain online materials.
More
Online Papers
Links to online papers and presentations. These include published papers, technical reports, slides from presentations and links to other related materials.
More
R Software
This page provides brief descriptions of R packages related to my work on data visualization and the history of statistical graphics.
- heplots: Visualizing multivariate hypothesis tests
- candisc: Generalized canonical discrimininant analysis
- vcd and vcdExtra: Visualizing categorical data
- Guerry: maps, data and methods related to Guerry's Moral Statistics of France
- HistData: Historical data sets
- tableplot: Semi-graphic tabular displays

SAS Software
These pages provide access to a large collection of SAS macros, SAS/IML programs, data sets and other materials developed in relation to my books, papers and courses, and made available through this site.
These programs are updated periodically and the latest versions are always available here.
- Graphical Methods
- Linear Models
- Categorical Data
- Structural Equation Models
- Utility Macros

