DataVis.ca
Michael Friendly
York University

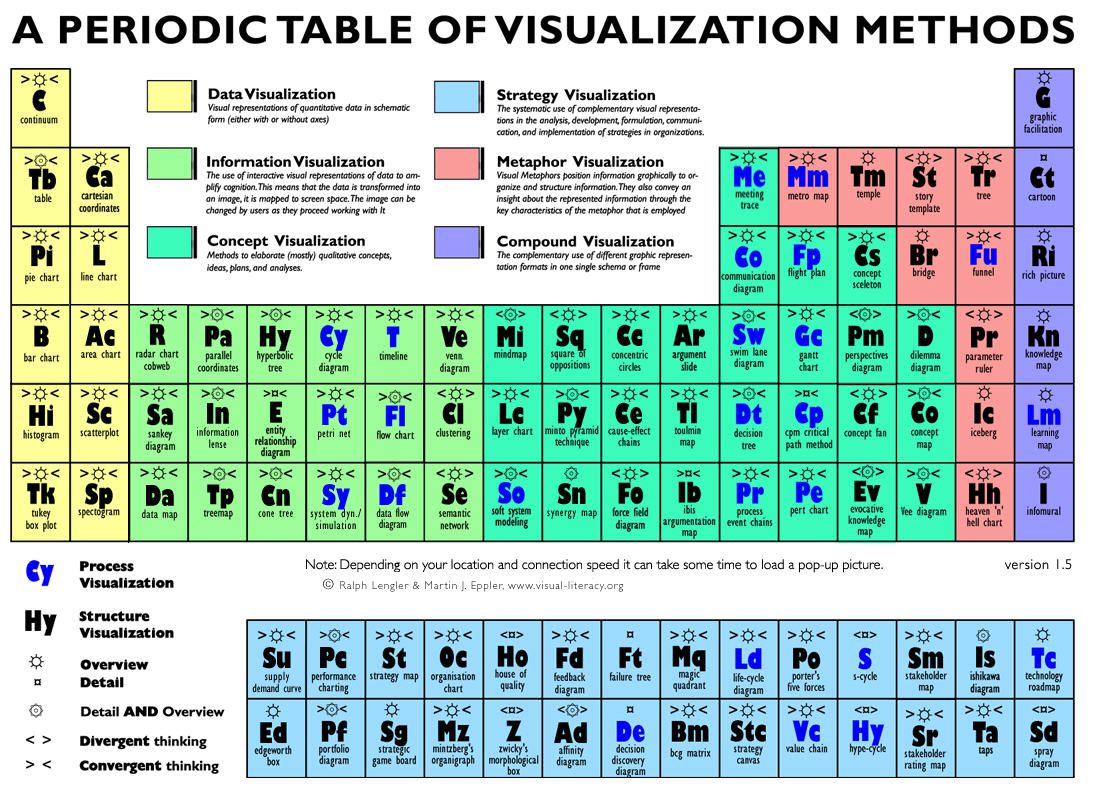
Title: A Periodic Table of Visualization Methods
Author: Ralph Lengler & Martin J. Eppler
Location: Lugano, Switzerland
Year: 2007
There are a number of schemes or theoretical approaches to classifying methods of information visualization. Among the highlights are Jacques Bertin's Semiologie Graphique and Lee Wilkinson's Grammar of Graphics.
This image, from the www.visual-literacy.org web site takes a purely visual approach, attempting to show various aspects of visualization methods collectively in a form modeled on the periodic table of the elements. Colors refer to a classification of what is visualized: Data, Information, Concepts, Strategy, etc. As in the periodic table of the elements, the methods are supposed to increase in complexity from the top row down.
The web page (http://www.visual-literacy.org/periodic_table/periodic_table.html) is implemented in Javascript; each "element" has a corresponding pop-up example image.
Ref: Ralph Lengler and Martin J. Eppler. 2007. Towards a periodic table of visualization methods of management. In Proceedings of the IASTED International Conference on Graphics and Visualization in Engineering (GVE '07), Mohammad Alam (Ed.). ACTA Press, Anaheim, CA, USA, 83-88.
 Except where otherwise noted, the Gallery of Data Visualization by
Michael Friendly is licensed under a
Except where otherwise noted, the Gallery of Data Visualization by
Michael Friendly is licensed under a Creative Commons Attribution-NonCommercial 3.0 License. Please cite any uses of this work as shown below.
Citation: Friendly, Michael (2001), Gallery of Data Visualization, Electronic document, http://www.datavis.ca/gallery/,