DataVis.ca
Michael Friendly
York University

Title: Profiles Representing the Increase and the Decrease of the Waters of the Seine and the Rivers that it Receives
Author: Philippe Buache
Location: Paris, France
Year: 1770
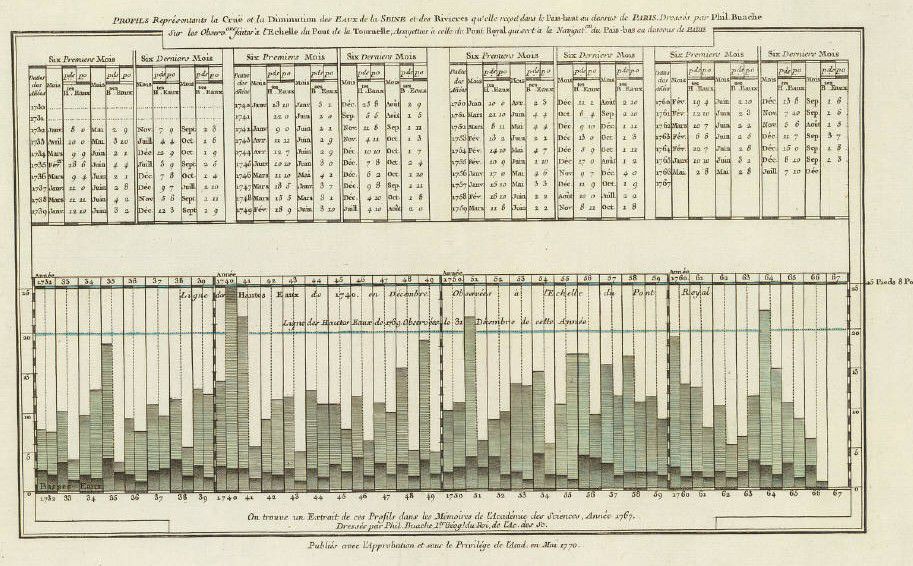
William Playfair (1786, 1801) is commonly considered as the inventor of most of the common graphic forms used today: the line graph, pie chart and bar chart. In fact, there is an earlier instance of a bar chart, and a double one at that, drawn by Phillipe Buache in 1770.
This image was part of a collection, Cartes et Tables de la Géographie Physique ou Naturelle. The table at the top shows the maximum and minimum heights of the Seine and month of observation from 1732 to 1767, for the first 6 and last 6 months of each year. These are graphed below in the form of overlaid bar charts.
It may be argued, of course, that for Buache, a physical geographer, profile charts of terrain were quite common, and this chart simply substitutes time for distance on the horizontal, a relatively small, concrete adaptation, while Playfair’s use to show economic data represents a more substantial, abstract adaptation.
Image Source: Royal Geographical Society, London, Image number: S0011903.
 Except where otherwise noted, the Gallery of Data Visualization by
Michael Friendly is licensed under a
Except where otherwise noted, the Gallery of Data Visualization by
Michael Friendly is licensed under a Creative Commons Attribution-NonCommercial 3.0 License. Please cite any uses of this work as shown below.
Citation: Friendly, Michael (2001), Gallery of Data Visualization, Electronic document, http://www.datavis.ca/gallery/,