DataVis.ca
Michael Friendly
York University

Laurels |
|---|
 Historical milestones
In statistical graphics, the past is often a fountain of ideas, as rich as the future. See our project on Milestones in the history of thematic cartography, statistical graphics, and data visualization for a comprehensive illustrated chronology.
| Picture | Words | |||
|---|---|---|---|---|
|
Mathematica graphic of Minard's depiction of the
fate of Napoleon's army, (from Shaw & Tigg, 1993). Full size (297x183),
or see Minard's original, Full size (569x273) [30K]
(scanned from Tufte, 1983).
The French engineer, Charles Minard (1781-1870), illustrated the disastrous result of Napoleon's failed Russian campaign of 1812. The graph shows the size of the army by the width of the band across the map of the campaign on its outward and return legs, with temperature on the retreat shown on the line graph at the bottom. Many consider Minard's original the best statistical graphic ever drawn. The first image shown here is drawn by a Mathematica
function, |
|||
|
Playfair's charts. (a) Balance of
Trade, Full size (510x356) [41K]; (b) Prices, wages and reigns, Full size
(504x267) [109K];
Chart of the National Debt of England
(390x669) [126K] (from Thomas Hankins
Blood, Dirt, and Nomograms)
William Playfair (1759-1823) is generally viewed as the inventor of most of the common graphical forms used to display data: line plots, bar chart and pie chart. His The Commercial and Political Atlas, published in 1786, contained a number of interesting time-series charts such as these. In the first, the area between two time-series curves was emphasized to show the difference between them, representing the balance of trade. The second graph plots three parallel time series: prices, wages, and the reigns of British kings and queens. Among the benefits of graphical display, Playfair said, "On inspecting any one of these Charts attentively, a sufficiently distinct impression will be made, to remain unimpaired for a considerable time, and the idea which does remain will be simple and complete, at once including the duration and the amount." Unfortunately, both of these charts are flawed, because they do not show directly the comparisons that Playfair intended. See our entry for Playfair's Charts, revisited for an example. |
|||
|
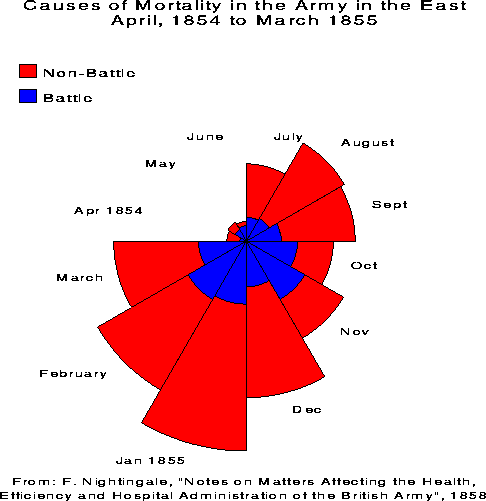
Florence Nightingale's Coxcomb diagrams
Coxcomb, original (537x462) [37K] ||
SAS re-creation (486x501) [5K]
Florence Nightingale (portrait [41k]) is remembered as the mother of modern nursing. But few realize that her place in history is at least partly linked to her use, following William Farr, Playfair and others, of graphical methods to convey complex statistical information dramatically to a broad audience. After witnessing deplorable sanitary conditions in the Crimea, she wrote Notes on Matters Affecting the Health, Efficiency and Hospital Administration of the British Army. (1858), an influencial text including several graphs which she called "Coxcombs". This figure (reproduced with SAS/Graph) makes it abundantly clear that far more deaths were attributable to non-battle causes ("preventable causes") than to battle-related causes. Aside from its historical interest, Nightingale's Coxcomb is notable for its display of frequency by area, like the pie chart. But, unlike the pie chart, the Coxcomb keeps angles constant and varies radius (proportional to square-root(frequency)), a principle used in the FourFold Display for 2x2xk tables. See the Flo's statistical links page for further information. An example of "Stigler's Law of Eponomy" (Stigler, 1980), Nightingale's Coxcomb chart did not orignate with her, though this should not detract from her credit. She likely got the idea from William Farr, a close friend and frequent correspondent, who used the same graphic principles in 1852. The earliest known inventor of polar area charts is Andre-Michel Guerry (1829). |
|||
") 
|
The 1854 London Cholera Epidemic. Full
size (368x320), from Gilbert, or original Full size image (1707 x 1800;
454kb) or
high-res PDF
versions from UCLA.
Also: Animated graphic, overlaying pumps and Thiessen polygons
The most famous, early example mapping epidemiological data was Dr. John Snow's map of deaths from a cholera outbreak in London, 1854, in relation to the locations of public water pumps. The original (high-res PDF copies from UCLA), spawned many imitators including this simplified version by Gilbert in 1958. Tufte (1983, p. 24) says,"Snow observed that cholera occurred almost entirely among those who lived near (and drank from) the Broad Street water pump. He had the handle of the contaminated pump removed, ending the neighborhood epidemic which had taken more than 500 lives." The earliest surviving map of disease incidence is that of Valerie Seaman on an outbreak of yellow fever in New York City in 1790. Our Early Medical Maps page describes two other early examples of epidemiological maps, from Arthur H. Robinson's, Early Thematic Mapping in the History of Cartography: Snow's (1855) map showing the areas served by two water companies, and Perry's (1844) map of incidence of an epidemic in Glasgow (darker shading means greater incidence). John Snow (1813 - 1858) was also the first physician to practice full-time as an anesthetist. See also John Snow, an historical giant in epidemiology; Tom Koch, Cartographies of Disease for a thorough analysis of Snow's contributions to epidemiological mapping, from historical and modern perspectives.
[Credits: Thanks to Tom Koch for historical corrections.]
|
|||
 |
Album de statistique graphique. larger (246x326) [19K] ||
Full page (672x871) [84K]
By the mid 1800s, many new forms of statistical graphics were being used to display data of economic and national interest in England, France, and elsewhere. This image, brought to my attention by Antoine de Falguerolles, is one of many beautiful statistical maps of France from the Album de statistique graphique, published annually by the Bureau de la statistique graphique of the Ministry of Public Works. from 1879 to 1899. A large-format book (about 12" by 15"), each figure folds out to four times that size, and contains exquisite detail and beautiful color tones, to which the images here cannot do justice. Many of these graphs were designed based on graphical innovations by Charles Minard, whose Napoleon's March graphic opens this Gallery. This particular flow map uses line thickness in a similar way to show the distribution of goods by rail throughout France, with different colors distinguishing different railway lines. Minard used and developed many other novel graphic forms, such as the Coxcomb (683x682) [62K] and the earliest known example [52K] of the mosaic display. See the beautiful book by Gilles Palsky, Des chiffres et des cartes, naissance et la cartographie quantitative francaise au XIXe siecle developpement for further information. |
|||
|
Research for this item by Abigail Friendly. |
Moseley's X-rays and the concept of atomic number.
Full size (543x345) [8K] or,
scan of the
original figure, from the
Philosophical
Magazine, 1913, p.1024-; 1914, p. 703-.
The hallmark of good science is the discovery of laws which unify and simplify disparate findings and allow predictions of yet-unobserved events or phenomena. Mendeleev's periodic table, for example, allowed him to predict the physical and chemical characteristics of Gallium (Ga) and Germanium (Ge) before they were discovered decades later. Mendeleev's table, however, arranged the elements only by a serial number, denoting an atom's position in a list arranged by increasing atomic mass. This changed in 1913-14 when Henry Moseley investigated the characteristic frequencies of X-rays produced by bombarding each of the elements in turn by high energy electrons. He discovered, that if the serial numbers of the elements were plotted against the square root of frequencies in the X-ray spectra emitted by these elements, all the points neatly fell on a series of straight lines. "Now if either the elements were not characterized by these integers, or any mistake had been made in the order chosen or in the number of places left for unknown elements, these regularities would at once disappear. We can therefore conclude from the evidence of the X-ray spectra alone, without using any theory of atomic structure, that these integers are really characteristic of the elements." This must mean that the atomic number is more than a serial number; that it has some physical basis. Moseley proposed that the atomic number was the number of electrons in the atom of the specific element. Moseley's graph represents an outstanding piece of numerical and graphical detective work. He noted that there were slight departures from linearity which he could not explain; nor could he explain the multiple lines at the top and bottom of the figure. The explanation came later with the discovery of the spin of the electron. See also, The Story of Moseley and X-rays. |
|||

|
Escaping the 2D plane: The Stereogram . Full size (613x727) [105k];
Construction illustration (392x625) [35k]
By the end of the 19th century, as more statistical data became available, the limitations of 2 dimensions of the plane for the representation of data were becoming more apparent. Several systems for representing 3D data were developed between 1869-1880. This figure (showing the population of Sweden from 1750-1875 by age groups) by Luigi Perozzo, from the Annali di Statistica, 1880, (Title page (372x561) [14k]), is the first example of a stereogram that I have seen. Perozzo credits Gustav Zeuner (1869) and Lewin with the invention of the (anonometric projection) representation in three dimensions, and also describes other related forms of perspective drawings by Becker and by Lexis, shown in his construction illustration. Perozzo's figure is also notable for being printed in color in a statistics journal, and in a way which enhances the perception of depth. See Caselli & Lombardo (1990), "Graphiques et analyse démographique: quelques éléments d'histoire et d'actualité", Population 45(2), 399-414, for these and other graphical developments related to demography. Also see Stereograms : A COOL application of Geometry
[Credits: Thanks to Antoine de Falguerolles for the Perozzo
article, and to Gilles Palsky for correcting my historical
attributions with the Caselli/Lombardo article]
|
|||
 |
Escaping the 2D plane: The Contour plot . Full size (357x506) [16k] Map of Paris by L.
L. Vauthier (1874), showing population density by contour lines, the
first statistical use of a contour map
A second approach to representing multivariate data arose from the use of contour maps in physical geography showing surface elevation (first published in 1752 by Buache), which became common in the early 19th century. It was not until 1843, however, that this idea was applied to data, when Léon Lalanne constructed the first contour plot [11k], showing the mean temperature, by hour of the day and by month at Halle. Lalanne's data formed a regularly-spaced grid, and it was fairly easy to determine the isolines of constant temperature. Vauthier generalized the idea to three-way data with arbitrary (x,y) values in his map of the population density of Paris. Galton later cited this as one of the inspirations for his normal correlation surface.
[Credits: Image: E. J. Marey (1878); Background: Palsky
(1996), Beniger & Robyn (1978)]
|
|||
 |
Dynamic graphics: Etienne-Jules Marey Traces of human respiration, under normal
conditions and exertion (630 x 190) [11k] || Chronophotography image (612 x 46) [9k]
Etienne-Jules Marey, 1830-1906, was among the pioneers of dynamic graphics and the graphical representation of movement and dynamic phenomena. This image, from Marey's La méthode graphique dans les sciences experimentales (1876, p. 150) compares the time course of respiration of a person at rest and under exertion, using a pen-recording device to plot the traces over time. Marey used and developed many devices to record and visualize motion and dynamic phenomena: walking, running, jumping, falling, of humans, horses, cats...; heart rate, pulse rate, breathing, etc. An exhibition in January, 2000 at the Fondation Electricite de France, Espace Electra (6 rue Recamier, Paris 7) is devoted to his works. The exposition web site, E. J. Marey: le mouvement en lunière is an electronic catalog worth a visit! |


![(portrait [41k])](images/portraits/nightingale.jpg)
![the first contour plot [11k]](images/palsky/lalanne.gif)