1600-1699: Measurement and theory
Among the most important problems of the 17th century were those concerned with physical measurement- of time, distance, and space- for astronomy, surveying, map making, navigation and territorial expansion. This century saw great new growth in theory and the dawn of practice- the rise of analytic geometry, theories of errors of measurement and estimation, the birth of probability theory, and the beginnings of demographic statistics and "political arithmetic".
By the end of this century, the necessary elements were at hand- some real data of significant interest, some theory to make sense of them, and a few ideas for their visual representation. Perhaps more importantly, one can see this century as giving rise to the beginnings of visual thinking.
early 1600s
Tables of empirical data, published tables of numbers begin to appear. "Die Tabellen-Statistik," as a branch of statistics devoted to the numerical description of facts- Germany.
Tables of empirical data, published tables of numbers begin to appear. "Die Tabellen-Statistik,'' as a branch of statistics devoted to the numerical description of facts
References:
 Le Nautonier portrait
 Le Nautonier's geomagentic map
 Modern re-creation of the magnetic equator after Le Nautonier
Tables, and first world map showing lines of geomagnetism (isogons), used in work on finding longitude by means of magnetic variation. The tables give the world distribution of the variation, by latitude, along each of the meridians
References:
Nautonier:1602 MandeaMayaud:2004
 Scheiner's pantograph
The pantograph was invented for mechanically copying a figure on an enlarged or reduced scale
References:
 Page 9v: craters on the moon
 Cover page from Sidereus Nuncius
The first astronomical pictures ever printed, from observations through a telescope, used to illustrate discoveries of craters on the moon, the 4 staelites of Jupiter and a vast number of stars never seen by unaided eyes
References:
Galilei:1610
 Two pages from Napier's table of logarithms
 Diagram of spherical triangles from
 Napier portrait
 Linear and logarithmic scales
Invention of logarithms, and the first published tables of logarithms.
In 1617, the year of his death, Napier invented a calculating device, called "Napier's Bones," based on logarithms to facilitate multiplication and division. Napier was also the first to describe the systematic use of the decimal point in representing the result of long division.
References:
Napier:1614
 Snellius portrait
First use of Frisius' method of trigonometric triangulation to produce locations of major cities in Holland; foundation of geodesy
In 1621, Willibrord Snell, in Cyclometricus, discovered the law of refraction which says that the ratio of the sines of the angles of incidence and refraction is a constant and the index of refraction varies from one transparent substance to another. This law implies that the velocity of light in a medium is inversely proportional to its refractive index. Cyclometricus was published after Snell's death by Rene' Descartes.
References:
Snell:1617
 Gunter's scale image
 Gunter's log scale
 Oughtred's dual log scale
Invention of a mechanical device, containing a logarithmic scale of equal parts and trigonomic functions which, with the aid of a pair of calipers, could be used as a slide rule. This device, called "Gunter's scale,'' or the "gunter'' by seamen, was soon replaced by a true slide rule, containing two parallel logarithmic scales
References:
Babcock:1994 Gunter:1624
 reproduction of Schickard's calculating clock
The first known adding machine, a mechanical calculator called the "Calculating Clock.'' It could add and subtract up to six-digit numbers, based on the movement of six dented wheels geared through a "mutilated" wheel which with every full turn allowed the wheel located at the right to rotate 1/10th of a full turn
References:
 Apparatus for recording sunspots
![]() Scheiner sunspot image
Scheiner sunspot image
Visual representations used to chart the changes in sunspots over time. Also, the first known use of the idea of "small multiples'' to show a series of images in a coherent display
References:
Scheiner:1626
 Galileo portrait
Statistical analysis of observations on location of Tycho Brahe's star of 1572, based on idea that the most probable hypothesis is the one having the smallest (least absolute value) deviations
References:
Galileo:1632 Hald:1990
 Descartes portrait
Coordinate system reintroduced in mathematics, analytic geometry; relationship established between graphed line and equation
About 1629, Pierre de Fermat discovered that the equation $f(x,y)=0$ represents a curve in the xy-plane. This is the fundamental principle of analytic geometry, and was first published by Descartes in 1637. He also formulated a method for determining the maximim and minimum values which give single solutions for problems which in general have two solutions. This procedure is "almost precisely that now given in the differential calculus''" ''(Boyer 1949:156).
References:
Descartes:1637
 Langren image
First visual representation of statistical data: variations in determination of longitude between Toledo and Rome
References:
Langren:1644
 Althanasius Kircher portrait
Invention of the first projection lantern (the magic lantern). [Images were painted on glass and projected on walls. Kirscher, a Jesuit priest, was the last recorded ordained priest openly to concern himself with optics. Henceforth, the art of projecting images was classified as an entertainment and curtailed.]
References:
Kirscher:1646
 Pascal portrait
 William Petty portrait
The first large scale attempt at a scientific, economic survey (of the Irish estates confiscated by Oliver Cromwell), perhaps the first econometric study, leading to development of political arithmetic
References:
Petty:1665 Petty:1690
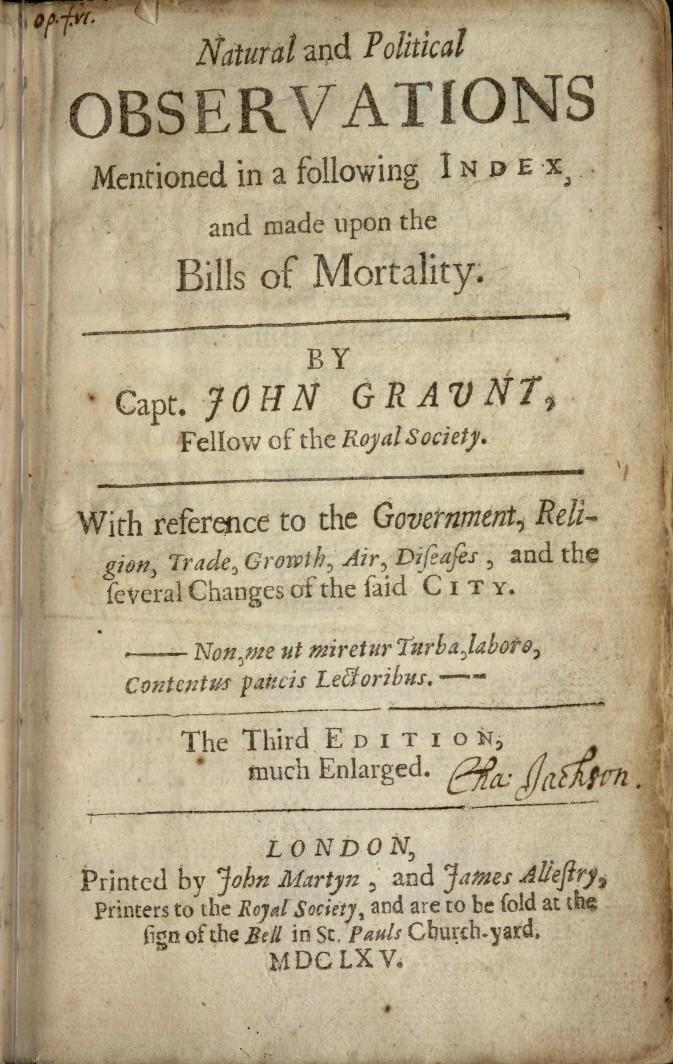 Cover page of "Natural and Political Observations..."
 Mortality table, from
 Graunt portrait
Founding of demographic statistics: Development of the idea that vital statistics (records of christenings and burials in London) could be used to construct life tables. The average life expectancy in London was 27 years, with 65\% dying by age 16
Graunt's work of 1662 is often ascribed to Sir William Petty. The authorship questionhas been discussed by Wilcoxwho concludes that although a portion ofthe work was by Petty, the majority is due to Graunt.
References:
Graunt:1662 Sutherland:1963 Petty:1665 Wilcox:1937
 Wren portrait
Automatic recording device (the weather clock) producing a moving graph of temperature and wind direction (in polar coordinates)
References:
Bennett:1982 Wren:1750First modern complete demographic census, a record of each individual by name of the 3215 inhabitants of New France
E. H. Godfrey says that this is "a date prior to any modern census, whether European or American'', seeThe returns were fairly complete, giving data on population, sexes, families, conjugal condition, age, profession and trades, and they filled 154 pages. The original copy is now in the Archives of Paris, and a transcript in the Archives of Ottawa.
References:
Godfrey:1918 JohnsonKotz:97
 Huygens graph
First graph of a continuous distribution function, a graph of Gaunt's life table, and a demonstration of how to find the median remaining lifetime for a person of given age
Source: correspondence between Huygens and his brother Lodewijk.
References:
Boyer:1947
 de Witt portrait
First attempt to determine scientifically what should be the purchase price of annuities, using mortality tables
References:
deWitt:1671
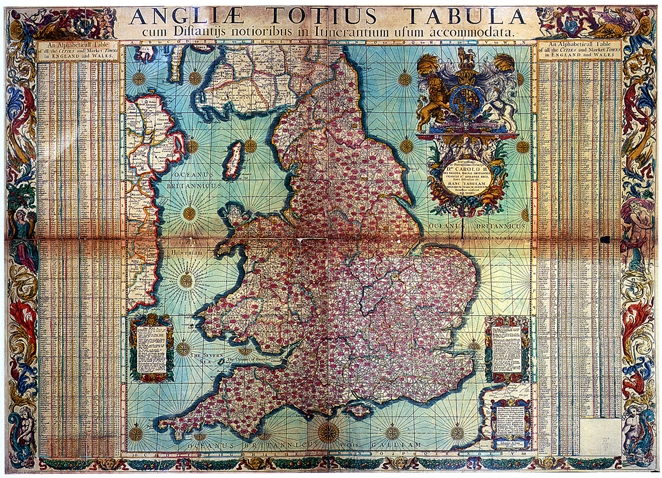 Adams1679
A map of England showing distances between cities arranged for the use of travellers.
References:
Adams:1679
 Halley's graph of change in barometric pressure
Bivariate plot of a theoretical curve derived from observations (barometric pressure vs. altitude), graphical analysis based on empirical data
References:
Halley:1686
 Halley portrait
 Halley's wind map, section 1 detail
 Halley's wind map, 1686
First known weather map, showing prevailing winds on a geographical map of the Earth
References:
Halley:1686a
 Petty portrait
Use of statistics for international comparisons, e.g., London vs. Rome and London vs. Paris, compared in people, housing, hospitals, etc.
References:
Petty:1687a Petty:1687bFirst real mortality tables, containing the ages at death of a stable sample of individuals under stable conditions (from Breslau Bills of Mortality)
References:
Halley:1693
 Halley 1893 2D diagram
 Halley 1893 3D diagram
 Halley's diagram
First use of areas of rectangles to display probabilities of independent binary events