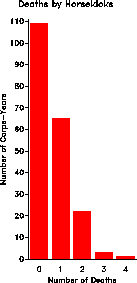
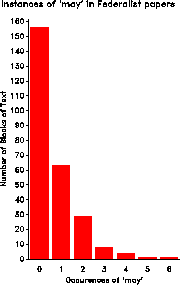
The table below shows two such data sets:
    Deaths by Horsekick          Occurrences of 'may'

        k    nk                    k    nk
       ----------                 ----------
        0    109                   0    156
        1     65                   1     63
        2     22                   2     29
        3      3                   3      8
        4      1                   4      4
           -----                   5      1
           N=200                   6      1
                                      -----
                                      N=256
chi² = Sum from k=1 to K < ( n sub k - N p hat sub k ) > sup 2 over < N p hat sub k > ~ chi² ( K-1 )where p hat sub k is the estimated probability of each basic count, under the hypothesis that the data follows the chosen distribution.
For example, for the Poisson distribution, the probability function is
The maximum likelihood estimator of the parameter lambda is just the mean of the distribution,(1)
lambda Hat = Sigma k n sub k / N
For the horsekick data, the mean is 122/200 = .610, and calculation of Poisson probabilities (PHAT), expected frequencies, and contributions to chi² are shown below.
 k     nk      p        phat         exp     chisq

 0    109    0.545    0.54335    108.670    0.00100
 1     65    0.325    0.33144     66.289    0.02506
 2     22    0.110    0.10109     20.218    0.15705
 3      3    0.015    0.02056      4.111    0.30025
 4      1    0.005    0.00313      0.627    0.22201
      ===                        =======    =======
      200                        199.915    0.70537 ~  chi² (4)
In this case the chi² shows an exceptionally good
(unreasonably good?) fit. In the word frequency example, the fit of
the Poisson turns out not to be close at all. However, even a close
fit may show something interesting, if we know how to look;
conversely, it is useful to know why or where the data differ from a
chosen model.
(von Bortkiewicz's data is collapsed over 20 years and 14 army corps,
and the Poisson model assumes that the probability of a death is constant
for all years and corps. This assumption can be tested in the raw data,
by fitting a poisson model, deaths = year corps.
The effects of both year and corps are significant, indicating that
the homogeneity assumption is not met.)
Assume, for some fixed lambda , each observed frequency, n sub k equals the expected frequency, m sub k = N p sub k . Then, setting n sub k = N p sub k = { e sup {- lambda} lambda sup k } / { k ! } , and taking logs of both sides gives
log ( n sub k ) = log N - lambda + k log lambda - log k !which can be rearranged to
The left side of (2) is called the count metameter , and denoted phi ( n sub k ) = < k ! n sub k > / N . Hence, plotting phi ( n sub k ) against k should give a line with(2)
         phi (n sub k)
                         CI       CI      Confidence Int
k    nk        Y       center   width     lower    upper

0   109   -0.607      -0.617    0.130    -0.748   -0.487
1    65   -1.124      -1.138    0.207    -1.345   -0.931
2    22   -1.514      -1.549    0.417    -1.966   -1.132
3     3   -2.408      -2.666    1.318    -3.984   -1.348
4     1   -2.120      -3.120    2.689    -5.809   -0.432
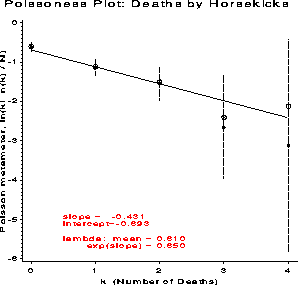
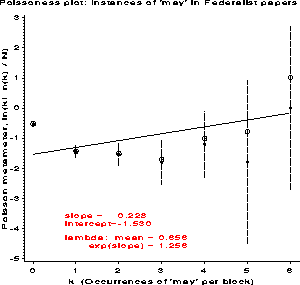
holds for each of the Poisson, binomial, negative binomial, and logarithmic series distributions. The slope, b , is zero for the Poisson, negative for the binomial, and positive for the negative binomial and logarithmic series distributions, which are distinguished by their theoretical intercepts.(3)
Thus, a plot of k n sub k / n sub k-1 against k , if linear, is suggested as a means to determine which distribution to apply.
+--------------------+--------------------------------------+
|   Slope  Intercept |     Distribution         Parameter   |
|    (b)     (a)     |     (parameter)          estimate    |
|--------------------+--------------------------------------|
|     0       +      |   Poisson (lambda)      lambda = a   |
|                    |                                      |
|     -       +      |   Binomial (n, p)       p = b/(b-1)  |
|                    |                                      |
|     +       +      |   Neg. binom (n,p)      p = 1 - b    |
|                    |                                      |
|     +       -      |   Log. series (theta)   theta =  b   |
|                    |                         theta = - a  |
+--------------------+--------------------------------------+
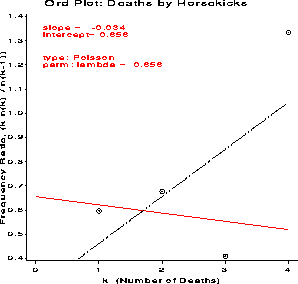
           Ord Plot: Deaths by Horsekicks

       k     nk    nk)       wk         y

       0    109      .    10.3923     .         -- Weighted LS --
       1     65    109     8.0000    0.5963     slope = -0.034
       2     22     65     4.5826    0.6769     inter = 0.656
       3      3     22     1.4142    0.4091
       4      1      3     0.0000    1.3333
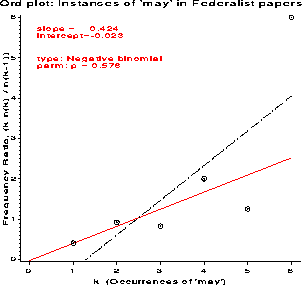
For the word frequency data, the slope is positive, so either the
negative binomial or log series are possible. The intercept is
essentially zero, which is ambiguous. However, the logarithmic
series requires b approx - a , so the negative binomial is
a better choice. Mosteller & Wallace did in fact find a reasonably
good fit to this distribution.
           Instances of 'may' in Federalist papers

       k     nk    nk)       wk         y

       0    156      .    12.4499     .       -- Weighted LS --
       1     63    156     7.8740    0.4038   slope = 0.424
       2     29     63     5.2915    0.9206   inter = -0.023
       3      8     29     2.6458    0.8276
       4      4      8     1.7321    2.0000
       5      1      4     0.0000    1.2500
       6      1      1     0.0000    6.0000
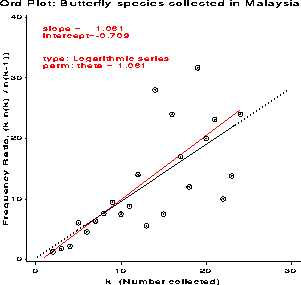
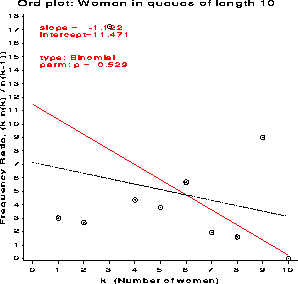
Plots of data fitting several different discrete distributions are
shown in Figure 4.