SAS Macro Programs for Statistical Graphics: BOXANNO and BOXAXIS
$Version: 1.7 (03 Feb 2004)
Michael Friendly
York University
BOXANNO.SAS contains two SAS macros to annotate a scatterplot with
marginal boxplots of one or more of the variables plotted with
either PROC GPLOT, PROC G3D or (as of Version 1.5) PROC GCHART .
- BOXAXIS
- Creates an Annotate data set to draw a boxplot
for one axis in a 2D or 3D scatterplot or a GCHART.
- BOXANNO
- Uses two calls to BOXAXIS to create an Annotate
data set for boxplots on both axes.
Use BOXANNO to draw the boxplots for both variables in a
scatterplot. For a G3D scatterplot, use one call to BOXANNO for
two of the variables and BOXAXIS for the third. See the examples
in "Section 4.5".
For separate use of BOXAXIS with the SAS autocall facility, you may
want to make a link from boxanno.sas to boxaxis.sas
in your local SASAUTOS directory. On Unix systems this would be
ln -s boxanno.sas boxaxis.sas
Parameters for BOXAXIS
- DATA=_LAST_
- Name of the input data set
- OUT=_DATA_
- Name of the output Annotate data set
- VAR=
- Variable for which a boxplot is constructed
- BAXIS=X
- Axis on which it goes. Must be X, Y, or Z for
a scatterplot, or MIDPOINT for a GCHART.
- OAXIS=Y
- The other axis in the plot
- PAXIS=Z
- The 3rd axis (ignored in GPLOT)
- BOXWIDTH=4
- Width of the box in percent of the data
range
- POS=98
- Position of the center of the box on OAXIS
in data percent. POS - BOXWIDTH/2 and POS +
BOXWIDTH/2 must both be between 0 and 100.
Example
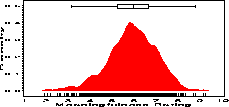
The following example shows a density display of the distribution of
rated meaningfulness for a collection of 925 English words, drawn with
the %density macro. The boxplot
at the top of the figure is drawn using the %boxaxis macro, giving an alternative display of the distribution.
axis1 order=(0 to .5 by .1) label=(a=90 'Density')
		offset=(3,);
pattern1 v=solid c=red;
symbol1 v=none i=join c=black;

%boxaxis(data=paivio, out=boxanno, var=meaning, pos=96, boxwidth=5);
%density(data=paivio, var=meaning, out=densplot,
	vaxis=axis1, haxis=axis2,
	symbol=symbol1,
	anno=boxanno,
	plotopt=%str(areas=1));
Parameters for BOXANNO
- DATA=_LAST_
- Name of the data set to be plotted
- XVAR=
- Name of the horizontal variable
- YVAR=
- Name of the vertical variable
- OUT=BOXANNO
- Output Annotate data set, containing the annotations
for the boxplots on both the horizontal and vertical axes.