1900-1949: Modern Dark Ages
If the early 1800s were the "golden age" of statistical graphics and thematic cartography, the early 1900s could be called the "modern dark ages" of visualization (FriendlyDenis:2001:valois).
There were few graphical innovations, and, by the mid-1930s, the enthusiasm for visualization which characterized the late 1800s had been supplanted by the rise of quantification and formal, often statistical, models in the social sciences. Numbers, parameter estimates, and, especially, standard errors were precise. Pictures were- well, just pictures: pretty or evocative, perhaps, but incapable of stating a "fact" to three or more decimals. Or so it seemed to statisticians.
But it is equally fair to view this as a time of necessary dormancy, application, and popularization, rather than one of innovation. In this period statistical graphics became "main stream." Graphical methods entered textbooks (Peddle:1910, Gilman:1917, Haskell:1919, Palmer:1921, Karsten:1925), the curriculum (Costelloe:1915, Warne:1916), and standard use in government (Ayres:1919), commerce (Gantt:1919, Shewhart:1931) and science.
In this period graphical methods were used, perhaps for the first time, to provide new insights, discoveries, and theories in astronomy, physics, biology, and other sciences. As well, experimental comparisons of the efficacy of various graphics forms were begun, e.g., (Eells:1926), and a number of practical aids to graphing were developed. In the latter part of this period, new ideas and methods for multi-dimensional data in statistics and psychology would provide the impetus to look beyond the 2D plane.
Graphic innovation was also awaiting new ideas and technology: the development of the machinery of modern statistical methodology, andthe advent of the computational power which would support the next wave of developments in data visualization.
 Du Bois portrait
At the Paris Exposition in 1900, W. E. B. Du Bois compiled an exhibit of hundreds of graphs and photographs depicting the history of Negroes in America, including over 60 statistical charts, graphs and maps.
References:
DuBois:1900:Georgia
 Exports from England and Ireland
In one of the first statistical textbooks, Arthur Bowley (1901) illustrated an arithmetic and graphical analysis of time-series data using the total value of British and Irish exports from 1855-1899. He presented a line graph of the time-series data, supplemented by overlaid line graphs of 3-, 5- and 10-year moving averages. His goal was to show that while the initial series showed wide variability, moving averages made the series progressively smoother.
References:
Bowley:1901
 On Chart Uniformity (pg. 1) - English Translation
 On Chart Uniformity (pg. 2) - English Translation
 On Chart Uniformity (pg. 3) - English Translation
 On Chart Uniformity (pg. 4) - English Translation
 On Chart Uniformity (pg. 5) - English Translation
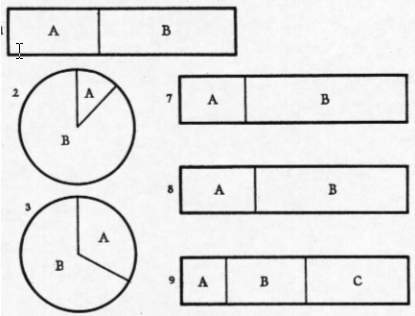
 On Chart Uniformity (pg. 6) - English Translation
This work by Cheysson and Fontaine, reported by Bertillon, was the first proposal of standards for graphical presentation. The paper "Proposals to bring uniformity in the preparation of charts" discusses some key recommendations, including cautious use of symbols and hieroglyphs, and sparing use of comparison by areas.
It is proposed that x and y scales be constructed so that the average behaviour corresponds to a curve of 45 degrees. Other attempts to formulate standards for graphical procedures at the International Statistical Congress are discussed in detail.
"We must be careful in wanting, in a graphic translation, to say too much at once. The main merit, one might say, the real purpose of the statistical chart, is the clarity." - Bertillon on Chart Uniformity
References:
Funkhouser:1937 vonHuhn:1931
 Maunder's butterfly diagram
 1904 Butterfly Diagram: Sunspots
Use of the "butterfly diagram'' to study the variation of sunspots over time, leading to the discovery that they were markedly reduced in frequency from 1645--1715 (the "Maunder minimum''). [Earlier work, started in 1843 by H. Schwabe, showed that sunspots exhibit an approximately twenty-two year cycle, with each eleven-year cycle of sunspots followed by a reversal of the direction of the sun's magnetic field]
References:
 Lorenz Curve
Lorenz curve (cumulative distribution by rank order, to facilitate study of concentrations, income distribution)
References:
Lorenz:1905Statistical diagrams begin to appear regularly in USA textbooks (graphs of temperature, population in texts of arithmetic, algebra)
References:
BenigerRobyn:1978
 Rosele portrait
 Trellis-like time series graphs of tuberculosis
 Trellis-like time series graphs of infant mortality
 3D Histogram: The course of death in Saxony
First International Hygiene-Exhibition in Dresden, with 259 graphical-statistical figures of 35 national and international exhibitors and more than 5 million visitors. [Roesle also wrote publications which dealt with the structure of graphical-statistical displays cite{Roesle:1913}.]
References:
Roesle:1911 Ostermann:01
 Hertzprung's first 1911 graphs
 early Hertzsprung-Russell diagram
 modern Hertzsprung-Russell diagram
The Hertzsprung-Russell diagram, a log-log plot of luminosity as a function of temperature for stars, used to explain the changes as a star evolves. It provided an entirely new way to look at stars, and laid the groundwork for modern stellar physics and evolution, developed independently by
References:
Hertzsprung:1911 SpenceGarrison:1993
 Probability paper
Arithmetic probability paper, ruled so that normal ogive appears as straight line
References:
Hazen:1914
 Photograph of the Parade of Statistical Graphics
Parade of statistical graphics, May 17, 1913, including large graphs on horse-drawn floats, and a photograph with people arranged in a bell-shaped curve
According to Brintonthe graph that most impressed people was one showing the decline in death rate due to improvements in sanitation and nursing.
References:
Brinton:1914
 Moseley portrait
![]() Moseley graph image
Moseley graph image
Discovery of the concept of atomic number, based largely on graphical analysis (a plot of serial numbers of the elements vs. square root of frequencies from X-ray spectra) The linear relations showed that the periodic table was explained by atomic number rather than, as had been supposed, atomic weight, and predicted the existence of several yet-undiscovered elements
References:
Moseley:1913College course in statistical graphic methods, "The Graphic Method'' (possibly the first)
References:
Costelloe:1915Published standards for graphical presentation (by representatives from several scientific societies)
References:
JCSGP:1914
 Comparative pictogram of copper production
 Proportion of College Graduates
 Ranks of states on educational features, Fig 33 (514 x 738; 112K)
Pictograms to represent a series of numbers by icons (combining concepts of the bar graph and pictogram of varying size)
References:
Brinton:1914
 R. A. Fisher portrait
Beginnings of the development of modern statistical theory (sampling distributions (1915), randomization, likelihood (1921), small sample theory, exact distributions, analysis of variance (1925), etc.)
References:
Fisher:1915 Fisher:1925 Bennett:1989Correspondence course in graphical methods (20 lessons for $50, supplemented by a book of 100 specimen illustrations of bar, curve, and circle diagrams; entended title includes "There's an idea in every chart'')
References:
Warne:1916
 Gantt Project
Gantt chart, designed to show scheduled and actual progress of projects
As a mechanical engineer and management consultant, Gantt also designed the 'task and bonus' system of wage payment and developed methods of measuring worker efficiency and productivity.
References:
Gantt:1919
 de Martonne portrait
 Distribution of nationalities in the the countries dominated by Roumanians (2925 x 1959; 1026K)
Use of ethnographic maps, showing the distribution of mixed nationalities, played an important role in redrawing national boundaries of Central Europe and the Balkans following World War I
De Martonne was a geographical expert and secretary of the Comité d'études, established by the French in 1915 to prepare guidelines for peace and the demarcation of boundaries. In this work, he had to develop ways to represent mixed distributions of different ethnic groups
References:
Martonne:1920 Palsky:1996Social statistical chartbook, containing a variety of graphic and semi-graphic displays in a USA Government report. [The image below is a fine early example of a semi-graphic display, showing four variables simultaneously.]
References:
Ayres:1919 Tufte:1983
 Wright's first path diagram
 Wright portrait
Invention of the path diagram to show relations among a network of endogenous and exogenous variables forming a system of structural equations
References:
Wright:1920Numerous textbooks on graphics, describing principles of graphical presentation of numerical information (published at a rate of about two each year), e.g.,
References:
Haskell:1919 Karsten:1925 Palmer:1921
 Zworykin,portrait, with kinescope
Invention of the iconoscope television camera-tube
References:
The essential idea behind what are now called partial residual plots are discussed in Ezekial's paper: "A method of handling curvilinear correlation for any number of variables". Later in history, this is rediscovered by Larsen and McCleary (1972).
References:
LarsenMcCleary:72 Ezekiel:1924
 Births and deaths in Germany, from
 Infant mortality and social position in Vienna, from
 Number of men living in Europe, from
![]() Neurath Isotype image
Neurath Isotype image
 Neurath portrait
Museum of Social Statistical Graphics and the ISOTYPE system (International System of Typographic Picture Education)
References:
Neurath:1973 Neurath:1991
 Walter Shewhart portrait
Development of the control chart for statistical control of industrial processes
References:
Shewhart:1931
 Experimental stimuli
Experimental test of statistical graphical forms (pie vs. subdivided bar charts)
References:
Eells:1926
 Graphical image used by Washburne: Income
 Graphical image used by Washburne: Population of Florence
Spate of articles on experimental tests of statistical graphical forms
References:
Huhn:1927 Croxton:1927 CroxtonStein:1932 CroxtonStryker:1927 Washburne:1927
 Thurstone portrait
The birth of psychometrics, including unidimensional scaling (the law of comparative judgment) and multiple factor analysis. This would give rise to visualizations in one or more dimensions of psychological constructs, like attitudes, preferences, and abilities.
References:
Thurstone:1927 Thurstone:1934
![]() Henderson nomogram icon
Henderson nomogram icon
Nomogram of chemical concentrations in blood, showing the relations among over 20 components
References:
Henderson:1928Ideograph, a multivariate rectangular glyph, invented to display four variables and their relations (length and width of petals and sepals in iris flowers)
References:
Anderson:1928 Kleinman:2002Electroencephalograph invented, to record electrical signals from the brain via galvanometers that measure electrical signals from electrodes on the scalp. EEGs were printed on multiple-pen, strip-chart recorders, with each channel showing the the amplitude from a given electrode.
In 1924, Berger made the first EEG recording in man and called it Electroenkephalogram. Berger was the first to describe the different brainwaves in the normal and abnormal brain. He also researched the nature of changes in EEG for brain diseases such as epilepsy.
References:
 Table of historical events drawn on logarithmic paper
Table of historical events drawn on logarithmic paper
von Foerster observed that the closer to the present, the more densely filled the paper was with historical events; conversely, the further you went back the thinner the table. Plotting the data using a logarithmic time scale allowed the history of time to be plotted on one table.
References:
"Log Square'' paper ($log y, log x$, for relations which are linear in log scales)
References:
MartinLeavens:1931Standard statistical symbols (Neurath's Isotype method) established by government decree (for schools, public posters, etc.)
References:
Neurath:1973
 Beck's initial underground map
 Beck portrait
Re-design of the routes of the London underground rail system to favor usability
Beck, an engineering draughtsman, designed the map like an electrical circuit board, using only vertical, horizontal and 45 degree angled lines. He located stations according to available space. The resulting map was geographically inaccurate, but easier to use to determine how to get from point A to B. Beck's idea was soon copied by most subway (and bus) companies around the world.
References:
Lapse of interest in statistical graphics, as concern with formal, "precise'', and numerical methods gained ascendancy (the modern "dark ages'' of statistical graphics)cite{FriendlyDenis:2001:valois}.
References:
Description of a memex, an associative information retrieval system which would help someone find information based in association and context rather than strict categorical indexing; conceptual creation of "hyperlink'' and the ''World Wide Web''
He foresaw this operating on an electric analog computer, which was completed in 1942. His description was published in the Atlantic Monthly, "As We May Think'' July, 1945
References:
 The "Mark I'' IBM ASCC
Harvard's Mark I, the first digital computer, put in service. Officially known as the "IBM Automatic Sequence Controlled Calculator'' (ASCC), the Mark I was 50 feet long and weighed about 5 tons.
The first official record of the use of the word "bug'' in the context of computing is associated with a relay-basedHarvard Mark II computer, which was in service at the Naval Weapons Center in Dahlgren, Virginia. On September 9th, 1945, a mothflew into one of the relays and jammed it. The offending moth was taped into the log book alongside the official report, whichstated: "First actual case of a bug being found.''
References:
 Harry Harmon portrait
Development of an electro-mechanical machine to aid in the rotation of multidimensional factor analysis solutions to "simple structure.'' This allowed an analyst to carry out by direct manipulation of dials what one did by plotting pairs of factors, and hand calculation of the rotation matrices in earlier times [(work carried out under the Adjutant General for development of the Armed Forces General Classification Test) cite{Tucker:2002}]